October 2024
Normandin Beaudry Pension Plan Financial Position Index, September 30, 2024
Click here for our index that tracks the Quebec municipal and university sector.
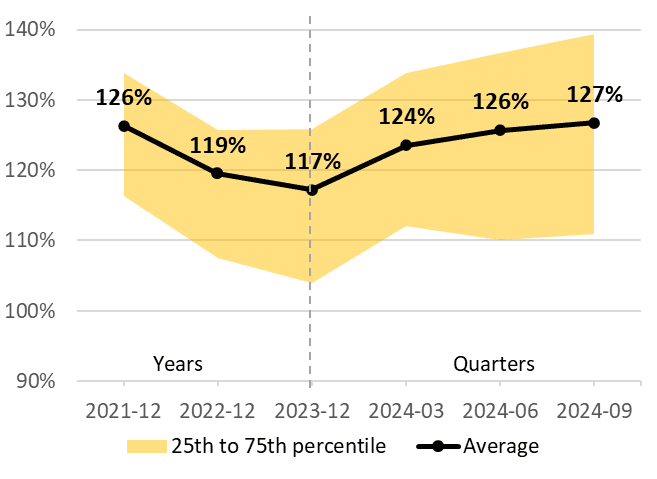
In Q3 2024, the average pension plan’s going concern and solvency financial positions remained stable.
As at September 30, 2024, the average pension plan funded ratio, excluding the effect of asset smoothing, is 127%. The ratio is up 1% in the third quarter and up 10% since the beginning of the year.

Note: The illustrated funded ratio excludes the effect of asset smoothing. A plan that uses this mechanism can therefore expect less significant change in its financial position.
The financial position changed little in Q3 2024. Although investment performance was favourable, pension liabilities increased due to lower discount rates.
Current service costs increased in the Q3 2024, bringing them close to levels seen at the beginning of the year.
The average solvency ratio of pension plans as at September 30, 2024, is 114%. It remained stable in the third quarter but is up 4% since the beginning of the year.
As with the going concern position, investment performance was favourable and actuarial liabilities of pension plans increased due to lower discount rates.
Since peaking in 2023, central banks recently announced their first rate cuts: three 0.25% cuts by the Bank of Canada and one 0.5% cut by the U.S. Federal Reserve. With annual inflation currently sitting in its target range of 1% to 3%, the Bank of Canada’s attention has turned to weaker economic growth and rising unemployment.
Despite the economic slowdown, the main stock and bond indices delivered strongly positive performances in response to central bank stimuli. In general, U.S. tech giants continued to dominate the markets, accentuating the high concentration of AI-related stocks in global market indices. Low-volatility equity strategies also performed well during the quarter, despite their more defensive profile.
Even if the recent key interest rate cuts have no immediate impact on direct real estate and infrastructure investments, they will generally have a positive long-term impact on the valuation of these assets.
Given the favourable financial position of pension plans, it may be a good time to review the investment strategy using a funding-driven investment (FDI) analysis, otherwise known as “asset-liability analysis”, especially if there have been significant changes to the following factors since the last analysis:
| Factors | Examples |
|
|
|
|
|
|
|
|
Moreover, the FDI analysis is in line with the risk management framework described in Guideline No. 10 issued by the Canadian Association of Pension Supervisory Authorities (CAPSA) in September. The purpose of this guideline is to define best practices for risk management in pension plan administration, taking into account the fiduciary duties incumbent on administrators.
- Average funded ratio: 127% as at September 30, 2024 / up 1% over the third quarter and up 10% year-to-date
- Average solvency ratio: 114% as at September 30, 2024 / no change over the third quarter and up 4% year-to-date
- Positive returns over the quarter in stock and bond markets
- Lower discount rates in the third quarter, increasing liabilities and current service costs
Would you like to learn more about using a funding-driven investment analysis for risk management? Contact your Normandin Beaudry consultant or email us.
The Normandin Beaudry Pension Plan Financial Position Index is calculated by projecting the pension plan financial data of its Canadian clients, excluding plans in the Quebec municipal and university sector. A separate index is published for these pension plans. Assets are projected based on the performance of market indices. Liabilities projected on a going concern basis use an estimated discount rate based on each plan’s asset allocation and the sensitivity of asset classes to changes in interest rates on Government of Canada bonds. The discount rates used on a solvency basis are those prescribed by the Canadian Institute of Actuaries, and those for transfer values are therefore based on the previous month’s market interest rates.
